
We will cover the following topics.
- Why manage the Budget?
- Major components of a personal finance system
- Using Excel to set personal budgets, record income and expenses
- Visualizing the data using charts
Why manage the Budget?
Let’s face it, the world we live in is fuelled by money. We go to school to get a good job and engage in business and other related activities with the main goal of making money. If we do not manage our finances properly, then all of our efforts go to waste.
Most people spend more than they earn. To be financially successful, one needs to develop a habit of spending less than one earn and invest the surplus in business ventures that will multiply the invested money
Major components of a personal finance system
This is a basic personal finance system so we will consider the following components;
- Projected income – this is the money that you expect to earn now and in the future.
- Budget – this is a list of the items that you expect to buy, their quantities and their respective prices
- Actual income – this is the actual money that you earn as time progresses
- Actual expenditure – this is the money that you spend buying things
The variance between the projected income and actual income gives us the performance indicator of how accurate our estimates are or how hard we are working.
The variance between the budget and the actual expenditure gives us the performance indicator of how disciplined we are when it comes to sticking to a budget.
Since saving is a part of the goal of having a personal finance system, the actual income vs. the actual expenditure say every month gives us an idea of how much we would save over a year.
Using Excel to set personal budgets, and record income and expenses
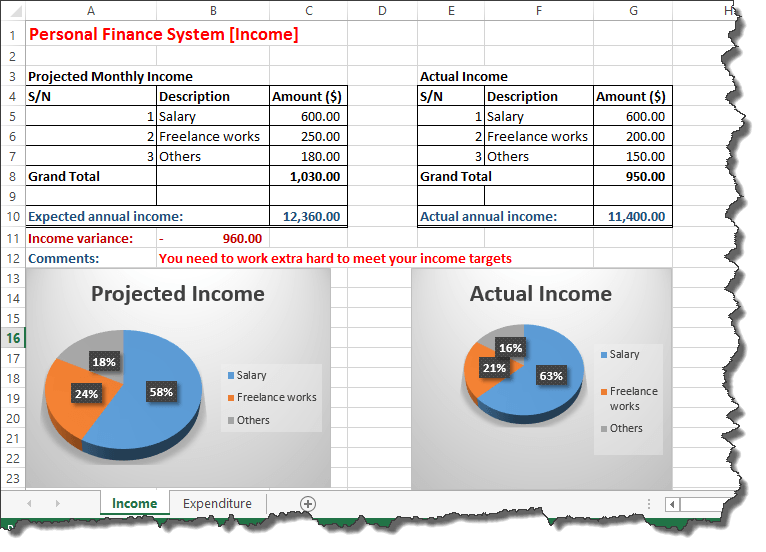
We have looked at the components of a personal finance system, and we will now use what we have learnt so far to implement the above personal finance Excel workbook. We will create two workbooks for this Excel personal finance tutorial, one for income and the other for budgets.
When you are done with this tutorial, your workbooks should look as follows:
 Here are the steps on how to create a personal budget in Excel:
Open Excel and create a new workbook
Income sheet
- Rename the Sheet1 to Income
- Enter the data shown below
- Projected Monthly Income
| S/N | Description | Amount ($) |
|---|---|---|
| 1 | Salary | 600.00 |
| 2 | Freelance works | 250.00 |
| 3 | Others | 180.00 |
| Grand Total | ||
| Expected annual income: |
Actual Income
| S/N | Description | Amount ($) |
|---|---|---|
| 1 | Salary | 600.00 |
| 2 | Freelance works | 200.00 |
| 3 | Others | 150.00 |
| Grand Total | ||
| Actual annual income: |
Formulas for Income sheet
We will now need to;
- Calculate the monthly income for both projected and actual income.
- Compute the projected annual income and actual annual income based on the monthly total.
- Find the variance between the actual and project annual income
- Show tips on how we are doing using logical functions
- Use conditional formatting to highlight how well we are managing our finances
Tutorial Exercise 1
- Find the sum of all monthly income sources. Use the SUM function. Do this for both projected and actual monthly income to manage personal finance in Excel.
- Find the annual projected and actual income by multiplying your answer in question 1 by 12.
- Find the income variance by subtracting the projected annual income from the actual annual income.
- Add a comments row just below the tables. Use the IF functions to display “You need to work extra hard to meet your income targets” if the variance is less than zero (0) else display “Great job working smart and harder”.
- Use conditional formatting to change the text colour to red if the variance is less than 0 else change the text colour to green.
If you are stuck on what to do, read the articles on formulas and functions, and Visualise data using charts in Excel.
Expenditure sheet
Add a new sheet and rename it to Expenditure
Enter the data as shown below:
Budget
| S/N | Item | Qty | Price | Subtotal |
|---|---|---|---|---|
| 1 | Rentals | 12 | 210.00 | |
| 2 | Bills | 12 | 100.00 | |
| 3 | Groceries | 12 | 230.00 | |
| 4 | School | 2 | 500.00 | |
| 5 | Miscellaneous | 6 | 133.00 | |
| Grand Total: |
| Expected Annual savings: |
Actual income:
| S/N | Description | Qty | Price | Subtotal |
|---|---|---|---|---|
| 1 | Rentals | 12 | 210.00 | |
| 2 | Bills | 12 | 145.00 | |
| 3 | Groceries | 12 | 240.00 | |
| 4 | School | 2 | 500.00 | |
| 5 | Miscellaneous | 6 | 233.00 | |
| Grand Total: |
| Actual Annual Savings: |
Formulas for Expenditure sheet
We will need to;
- Calculate the subtotal
- Calculate the total based on subtotals
- Compute the expected annual savings. The expected annual savings is the difference between the projected annual income and the budget total amount. This will be done for the actual income and actual expenditure too.
- Compute the variance of the monthly saving
- Add a comments row just below the tables. Use the IF functions to display “You need to minimize your expenses.” if the variance is less than zero (0) else display” Great job sticking to the budget”.
- Use conditional formatting to change the text colour to red if the variance is less than 0 else change the text colour to green.
Tutorial exercise 2
Write formulas that implement the above scenarios.
Visualizing the data using charts
Charts are a great way of visualizing our data. We will now add a pie chart to our income sheet for the projected monthly income. The image below shows our data.

As marked in the above image our chart should only show the data for
- Item column
- Subtotal column
Highlight items 1 to 5 in the Item column
Hold the Ctrl button on the keyboard and highlight the subtotals from 1 to 5 in the subtotals column.
Your selection should look as shown in the image below:

Click on the INSERT tab from the main menu

- Use the charts ribbon bar, click on the pie chart drop-down and select a pie chart of your choice.
- Your pie chart should now look similar to the one shown below

Tutorial exercise three
Create charts for the actual expenditure, projected income, and actual income.
Summary
In this tutorial, we have learnt and applied the knowledge gained in the previous tutorials. We have also been able to visualize our data using charts.